 Eight Americas: Investigating Mortality Disparities across Races, Counties, and Race-Counties in the United States
Christopher J. L. Murray Sandeep C. Kulkarni, Catherine Michaud, Niels Tomijima, Maria T. Bulzacchelli, Terrell J. Iandiorio, Majid Ezzati
PLoS Medicine September 2006, vol. 3 Issue 9: 1513-1524
Editor's Summary
Background.
It has been recognized for a long time that the number of years that people in the United States can expect to live (“life expectancy”) varies enormously. For example, white Americans tend to live longer than black Americans, and life expectancy is much greater in some of the roughly 3,000 counties of the US than it is in others. However, there is a lack of information and understanding on how big a part is played in “health inequalities” by specific diseases and injuries, by risk factors (such as tobacco, alcohol, and obesity), and by variations in access to effective health care.
Why Was This Study Done?
The researchers wanted to find a way of dividing the people of the US into groups based on a small number of characteristics—such as location of county of residence, race, and income—that would help demonstrate the most important factors accounting for differences in life expectancy.
What Did the Researchers Do and Find?
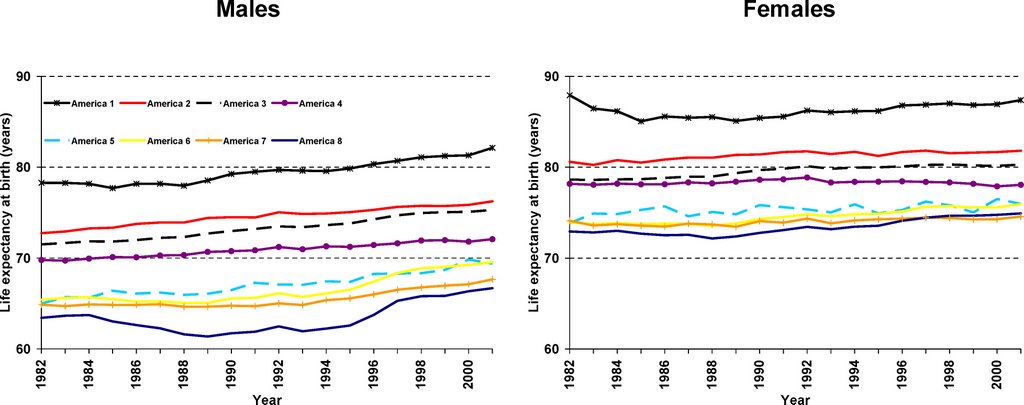
The researchers used figures from the US Census Bureau and the National Center for Health Statistics to calculate mortality (death) rates for the years 1982–2001. They took note of the county of residence and of the race of all the people who died during that period of time. This enabled them to calculate the mortality rates for all 8,221 “race-county units” (all of the individuals of a given race in a given county). They experimented with different ways of combining the race-counties into a small and manageable number of groups. They eventually settled on the idea of there being “eight Americas,” defined on the basis of race-county, population density, income, and homicide rate. Each group contains millions or tens of millions of people. For each of the eight groups the researchers estimated life expectancy, the risk of mortality from specific diseases, the proportion of people who had health insurance, and people's routine encounters with health-care services. (The researchers also created maps of life expectancies for the US counties.) They describe their eight Americas as follows: Asians, northland low-income rural whites, Middle America, low-income whites in Appalachia and the Mississippi Valley, western Native Americans, black Middle America, low-income southern rural blacks, and high-risk urban blacks.
Many striking differences in life expectancy were found between the eight groups. For example, in 2001, the life expectancy gap between the 3.4 million high-risk urban black males and the 5.6 million Asian females was nearly 21 years. Within the sexes, the life expectancy gap between the best-off and the worst-off groups was 15.4 years for males (Asians versus high-risk urban blacks) and 12.8 years for females (Asians versus low-income rural blacks in the South). The causes of death that were mainly responsible for these variations were various chronic diseases and injury. The gaps between best-off and worst-off were similar in 2001 to what they were in 1987.
What Do These Findings Mean?
Health inequalities in the US are large and are showing no sign of reducing. Social and economic reforms would certainly help change the situation. At the same time, the public health system should also improve the way in which it deals with risk factors for chronic diseases and injuries so that groups with the highest death rates receive larger benefits.


No comments:
Post a Comment