The new issue of Science only briefly touches on why this is the 2007 breakthrough. There's a short piece by Elizabeth Pennisi and another by Jocelyn Kaiser. There is also a video about halfway down on this page. At least they had a short part on the burgeoning industry of personal genomics. One area that they side-stepped however was all the genetic information we've been getting on population differences, and on genetic ancestry. Again, the whole thing was just too short. The cover photo is of a guy wearing a t-shirt that has the annotated gene-sequence map of human chromosome 1.
Thursday, December 27, 2007
Science Breakthrough of the Year: Human Genetic Variation
The new issue of Science only briefly touches on why this is the 2007 breakthrough. There's a short piece by Elizabeth Pennisi and another by Jocelyn Kaiser. There is also a video about halfway down on this page. At least they had a short part on the burgeoning industry of personal genomics. One area that they side-stepped however was all the genetic information we've been getting on population differences, and on genetic ancestry. Again, the whole thing was just too short. The cover photo is of a guy wearing a t-shirt that has the annotated gene-sequence map of human chromosome 1.
Wednesday, December 26, 2007
Cooking food allowed for bigger brains in humans
This is the hypothesis that Richard Wrangham describes in his interview in this Scientific American article. This idea has been around for a while (see here, for example). The trouble has been establishing when hominins were able to "get fire". Some estimates point to as far back as 1.7 million years ago. In this interview, Richard Wrangham talks about the differences between chimp diets and human diets, and how modern day humans and hunter gatherers can't eat some of the fibrous, bitter, tough foods that chimps routinely rely on. He says that cooking food would have been the single greatest improvement in the quality of our diet - so he thinks that cooking would lead to a higher quality diet more so that just getting meat, or tubers, or nuts etc !!! This is the kind of hypothesis that is ripe (excuse the pun) for testing using genetics, as he mentions at the end of the interview when he talks about looking at genes involved in the Maillard reaction. I don't understand why he talks about using Homo erectus DNA though. First of all, that's not possible (yet?), and I think there are ways to answer a question like that just using modern human DNA, or by comparing humans to other primates.
Thursday, December 20, 2007
Macachiavellian intelligence
 I don't usually talk about popular science books, but this one looks pretty interesting, given that I'm interested in brain size and how it may be related to social intelligence.
...and related to this is a review paper in the latest issue of Evolutionary Anthropology:
Unity in diversity: Lessons from macaque societies
Bernard Thierry
Evolutionary Anthropology: Volume 16, Issue 6, 2007
Abstract: The macaque radiation is as old as the hominin radiation, approximately 7 million years. After Homo, Macaca has the widest geographical range among primates, and both of these genera are present in tropical and temperate regions as well. Whereas the single extant representative of the genus Homo diverged through processes of cultural diversification, extant species of macaques emerged through processes of evolutionary diversification. Macaque societies are characterized by profound unity and great diversity, and can best be described as variations on the same theme. To understand macaque variation and adaptation, we must take into account the processes that insure the persistence of their societies across generations and environments.
Tuesday, December 18, 2007
NAT2 variants and the transition to agriculture in Central Asia
First what is NAT2? It's a gene involved in the acetylation of xenobiotics (foreign substances) and carcinogens - basically getting rid of toxins. They hypothesize that they will find different versions of this gene depending on whether a group is traditionally pastoralist or agriculturalist. They focus in on Central Asia where there is still some diversity among groups in subsistence. They don't really explain why there would have been selection for getting rid of foreign substances with an agricultural diet. They mention cooking meat at high temperatures, but that doesn't really seem to make the case... so, what is it about an agricultural, sedentary lifestyle that would select for the ability to neutralize or get rid of foreign stuff? This may be kinda obvious, like in the case of parasites, but they don't really seem to focus on that, so I wish they would have mentioned some other examples of what they meant. Anyway, their choice of populations to study seemed appropriate and interesting.
From the discussion section, mentioning converging evidence among groups in Africa:
Population genetic diversity of the NAT2 gene supports a role of acetylation in human adaptation to farming in Central Asia
Hélène Magalon, Etienne Patin, Frédéric Austerlitz, Tatyana Hegay, Almaz Aldashev, Lluís Quintana-Murci and Evelyne Heyer
European Journal of Human Genetics Advance online publication
From the discussion section, mentioning converging evidence among groups in Africa:
A similar dichotomous pattern at the NAT2 gene has been observed among sub-Saharan Africans, where the Bantu-speaking agriculturalists presented a higher frequency of slow acetylators, as compared to the Pygmy hunter-gatherers (0.46 and 0.10, respectively).33 These significant differences in the frequency distribution of slow/fast acetylation phenotypes depending on lifestyle, attested by significant FST estimates, strongly suggest that being slow acetylator has been an advantage in long-term agriculturalist populations in Central Asia.They then discuss the alternative hypotheses for their findings:
This observation can be explained by three different, non-mutually exclusive hypotheses: (1) demographic processes, (2) balancing selection or (3) directional selection on standing variation.They go through each one and discuss it in light of their findings. All in all, I liked the general idea of the study, and I think that we will see many more such studies about recent selection due to novel environments. However, in this specific case, I am left to wonder about what exactly the selective advantage is in the environment of agricultural groups (what xenobiotics?, carcinogens?), and if it is linked to the variants of this particular gene... probably beyond the scope and purpose of this particular study.
Population genetic diversity of the NAT2 gene supports a role of acetylation in human adaptation to farming in Central Asia
Hélène Magalon, Etienne Patin, Frédéric Austerlitz, Tatyana Hegay, Almaz Aldashev, Lluís Quintana-Murci and Evelyne Heyer
European Journal of Human Genetics Advance online publication
Abstract: The arylamine N-acetyltransferase 2 (NAT2) enzyme detoxifies a wide spectrum of naturally occurring xenobiotics including carcinogens and drugs. Variation at the NAT2 gene has been linked to the human acetylation capacity, either 'slow' or 'fast', which modifies susceptibility to cancer and adverse drug reactions. We investigated the possible influence of natural selection in shaping the acetylation phenotype and the NAT2 gene variability in six Central Asian populations, who are either long-term sedentary agriculturalists (two Tajik populations), recent sedentary agriculturalists (Kazakhs, Uzbeks) or nomad pastoralists (two Kirghiz populations). To this end, we sequenced the entire NAT2 coding exon, as well as genotyping nine intergenic SNPs covering a 200-kb region. Our results revealed that the two Tajik populations exhibited significantly higher proportions of slow acetylators than the nomadic populations. In addition, sequence-based neutrality tests yielded significantly positive values in Central Asian populations following an agriculturalist lifestyle, due to an excess of haplotypes at intermediate frequencies. Taken together, our data suggest that balancing selection, and/or directional selection on standing low-frequency alleles, have shaped NAT2 genetic diversity and the human acetylation phenotype in Central Asian agriculturalists. These results further support the hypothesis that a major transition in human lifestyle, such as the emergence of farming has dramatically changed human chemical environments and the selective pressures they imposed.
ACTN3 in bodybuiders and powerlifters
 Those who are likely endowed with a high proportion of fast twitch muscle fibers are less likely to have a nonsense variant of ACTN3, is what they find among a set of black and white bodybuilders and powerlifters. This gene has been investigated in several different populations looking at the association between it and the type of sport (sprint or endurance) that individuals excel at. The overall findings are mixed, but highly suggestive. If interested, I've posted on this gene many times before (you can do a search for actn3 in the search box for this blog - in the Blogger banner at the top)
The ACTN3 R577X nonsense allele is under-represented in elite-level strength athletes
Stephen M Roth, Sean Walsh, Dongmei Liu, E Jeffrey Metter, Luigi Ferrucci and Ben F Hurley
European Journal of Human Genetics Advance online publication
Abstract: Previous reports have shown a lower proportion of the ACTN3 X/X genotype (R577X nonsense polymorphism) in sprint-related athletes compared to the general population, possibly attributed to impairment of muscle function related to -actinin-3 deficiency. In the present study, we examined the frequency of the X/X genotype in both Black and White elite-level bodybuilders and strength athletes in comparison to the general population. A reference population of 668 Whites (363 men and 305 women) and 208 Blacks (98 men and 110 women) was genotyped for the ACTN3 R577X polymorphism. Strength athletes (52 white and 23 black; 4 women) consisting predominantly of world class and locally competitive bodybuilders, and elite powerlifters were recruited and similarly genotyped. Significantly lower X/X genotype frequencies were observed in the athletes (6.7%) vs controls (16.3%; P=0.005). The X/X genotype was significantly lower in White athletes (9.7%) vs controls (19.9%; P=0.018). No black athletes (0%) were observed with the X/X genotype, though this finding only approached statistical significance vs controls (4.8%; P=0.10). The results indicate that the ACTN3 R577X nonsense allele (X) is under-represented in elite strength athletes, consistent with previous reports indicating that -actinin-3 deficiency appears to impair muscle performance.
Thursday, December 13, 2007
Blood pressure, skin color and income among African Americans
- These are very interesting and important findings. Can't wait to read the whole paper.
- Sweet E, McDade TW, Kiefe CI, Liu K.
- Am J Public Health. 2007 Dec;97(12):2253-9.
OBJECTIVES: We explored how income and skin color interact to influence the blood pressure of African American adults enrolled in the longitudinal Coronary Artery Risk Development in Young Adults (CARDIA) Study. METHODS: Data were derived from 1893 African American CARDIA year-15 participants who had undergone skin reflectance assessments at year 7. We adjusted for age, gender, body mass index, smoking status, and use of antihypertensive medication to examine whether year-15 self-reported family incomes, in interaction with skin reflectance, predicted blood pressure levels. RESULTS: Mean systolic and diastolic blood pressure levels were 117.1 (+/-16.07) and 76.9 (+/-12.5) mm Hg, respectively. After adjustment, the interaction between skin reflectance and income was significantly associated with systolic blood pressure (P< .01). Among lighter-skinned African Americans, systolic pressure decreased as income increased (b= -1.15, P<.001); among those with darker skin, systolic blood pressure increased with increasing income (b=0.10, P=.75). CONCLUSIONS: The protective gradient of income on systolic blood pressure seen among African Americans with lighter skin is not observed to the same degree among those with darker skin. Psychosocial stressors, including racial discrimination, may play a role in this relationship.
Wednesday, December 12, 2007
Why are pygmies smaller?
This paper uses a life history perspective and data from two pygmy populations from the Philipito answer that question. I've only read the abstract, but it sounds like that they are arguing that being forced into early reproduction selected for less energy into body growth, due to high mortality levels. Why high mortality?... I don't know...maybe just being in the tropics?.. the answer is probably in the paper.
via Razib's GNXP
Life history trade-offs explain the evolution of human pygmies
Andrea Bamberg Migliano, Lucio Vinicius, and Marta Mirazón Lahr
PNAS Published online before print December 11, 2007
via Razib's GNXP
Life history trade-offs explain the evolution of human pygmies
Andrea Bamberg Migliano, Lucio Vinicius, and Marta Mirazón Lahr
PNAS Published online before print December 11, 2007
Abstract: Explanations for the evolution of human pygmies continue to be a matter of controversy, recently fuelled by the disagreements surrounding the interpretation of the fossil hominin Homo floresiensis. Traditional hypotheses assume that the small body size of human pygmies is an adaptation to special challenges, such as thermoregulation, locomotion in dense forests, or endurance against starvation. Here, we present an analysis of stature, growth, and individual fitness for a large population of Aeta and a smaller one of Batak from the Philippines and compare it with data on other pygmy groups accumulated by anthropologists for a century. The results challenge traditional explanations of human pygmy body size. We argue that human pygmy populations and adaptations evolved independently as the result of a life history tradeoff between the fertility benefits of larger body size against the costs of late growth cessation, under circumstances of significant young and adult mortality. Human pygmies do not appear to have evolved through positive selection for small stature—this was a by-product of selection for early onset of reproduction.
Wednesday, December 05, 2007
Studying genetic admixture in South vs. North America
This paper examines whether a subset of AIMs (Ancestry Informative Markers) are useful for looking at admixture among indigenous South American populations, given that these AIMs were developed using North and Central American Native American parental populations. They find little difference between the frequencies of South and North American Native American populations. I wish I had full-text access to this paper to see the results more closely. They looked at 4 tribes in the Amazon. They state in the abstract that those seven AIMs can be used to differentiate between the four tribes. That's surprising to me. Again, I wish I could see the results. Time for inter-library loan, I guess.
Ancestry informative markers in Amerindians from Brazilian Amazon
Marcelo Rizzatti Luizon, Celso Teixeira Mendes-Junior, Silviene Fabiana De Oliveira, Aguinaldo Luiz Simões
American Journal of Human Biology v.19, #6 Nov/Dec 2007
Ancestry informative markers in Amerindians from Brazilian Amazon
Marcelo Rizzatti Luizon, Celso Teixeira Mendes-Junior, Silviene Fabiana De Oliveira, Aguinaldo Luiz Simões
American Journal of Human Biology v.19, #6 Nov/Dec 2007
Abstract: Ancestry informative markers (AIMs) are genetic loci with large frequency differences between the major ethnic groups and are very useful in admixture estimation. However, their frequencies are poorly known within South American indigenous populations, making it difficult to use them in admixture studies with Latin American populations, such as the trihybrid Brazilian population. To minimize this problem, the frequencies of the AIMs FY-null, RB2300, LPL, AT3-I/D, Sb19.3, APO, and PV92 were determined via PCR and PCR-RFLP in four tribes from Brazilian Amazon (Tikúna, Kashinawa, Baníwa, and Kanamarí), to evaluate their potential for discriminating indigenous populations from Europeans and Africans, as well as discriminating each tribe from the others. Although capable of differentiating tribes, as evidenced by the exact test of population differentiation, a neighbor-joining tree suggests that the AIMs are useless in obtaining reliable reconstructions of the biological relationships and evolutionary history that characterize the villages and tribes studied. The mean allele frequencies from these AIMs were very similar to those observed for North American natives. They discriminated Amerindians from Africans, but not from Europeans. On the other hand, the neighbor-joining dendrogram separated Africans and Europeans from Amerindians with a high statistical support (bootstrap = 0.989). The relatively low diversity (GST = 0.042) among North American natives and Amerindians from Brazilian Amazon agrees with the lack of intra-ethnic variation previously reported for these markers. Despite genetic drift effects, the mean allelic frequencies herein presented could be used as Amerindian parental frequencies in admixture estimates in urban Brazilian populations.
Monday, December 03, 2007
Elephants can classify human ethnic groups by odor?
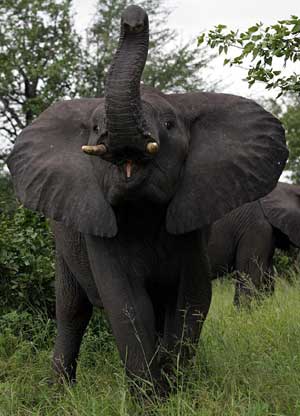 This one really caught my attention and I was seriously intrigued until I read the abstract and realized how easily I'm baited by that kind of topic and title. I thought maybe elephants could make software like STRUCTURE obsolete, but I was sadly mistaken...
Granted, their findings are kind of cool, but their title made me expect more. I guess the interesting thing here is that elephants aren't scared of all humans, but discriminate between ethnic groups, based on their potential threat.
Elephants classify human ethnic groups by odor and garment color
Lucy A. Bates, Katito N. Sayialel, Norah W. Njiraini, Cynthia J. Moss, Joyce H. Poole, and Richard W. Byrne
Current Biology Volume 17, Issue 22. November 2007
Abstract: Animals can benefit from classifying predators or other dangers into categories, tailoring their escape strategies to the type and nature of the risk. Studies of alarm vocalizations have revealed various levels of sophistication in classification [1, 2, 3, 4, 5]. In many taxa, reactions to danger are inflexible, but some species can learn the level of threat presented by the local population of a predator [6, 7, 8] or by specific, recognizable individuals [9, 10]. Some species distinguish several species of predator, giving differentiated warning calls and escape reactions; here, we explore an animal's classification of subgroups within a species. We show that elephants distinguish at least two Kenyan ethnic groups and can identify them by olfactory and color cues independently. In the Amboseli ecosystem, Kenya, young Maasai men demonstrate virility by spearing elephants (Loxodonta africana), but Kamba agriculturalists pose little threat. Elephants showed greater fear when they detected the scent of garments previously worn by Maasai than by Kamba men, and they reacted aggressively to the color associated with Maasai. Elephants are therefore able to classify members of a single species into subgroups that pose different degrees of danger.
Sunday, December 02, 2007
Friday, November 30, 2007
Group selection! - maybe not so blasphemous after all
 Group selection has long been a taboo topic just like the study of biological or genetic differences between human "races" had been a taboo topic. Several papers that have come out recently have acknowledged that group selection likely plays at least some kind of role in the process of natural selection.(here, here, here, here, here, here)
But finally, D.S. Wilson and E.O. Wilson have written up a paper that attempts to breathe even more life into this unjustly ignored and ridiculed idea.
I had read it a few months ago and was meaning to blog on it, but never got around to it, but I just saw a story about the paper which is supposed to be out now, but I couldn't find it on the website. It's available online from D.S. Wilson's website (link on title below). See further below abstract for a few more comments, and a great quote at the very end of this post.
Rethinking the Theoretical Foundation of Sociobiology
The Quarterly Review of Biology December 2007 v.82, no.4
Abstract: Current sociobiology is in theoretical disarray, with a diversity of frameworks that are poorly related to each other. Part of the problem is a reluctance to revisit the pivotal events that took place during the 1960s, including the rejection of group selection and the development of alternative theoretical frame- works to explain the evolution of cooperative and altruistic behaviors. In this article, we take a “back to basics” approach, explaining what group selection is, why its rejection was regarded as so important, and how it has been revived based on a more careful formulation and subsequent research. Multilevel selection theory (including group selection) provides an elegant theoretical foundation for sociobiology in the future, once its turbulent past is appropriately understood
When Rabbi Hillel was asked to explain the Torah in the time that he could stand on one foot, he famously replied: “Do not do unto others that which is repugnant to you. Everything else is commentary.” Darwin’s original insight and the developments reviewed in this article enable us to offer the following one foot summary of sociobiology’s new theoretical foundation: “Selfishness beats altruism within groups. Altruistic groups beat selfish groups. Everything else is commentary."
Wednesday, November 28, 2007
Chalk another one up for "environment"
What contributes to the disparities in health between ethnic groups in the US: genetic or environmental differences between groups? ... well, both probably, but we have a long way to go in identifying all the specific genetic and environmental variants that contribute to these disparities, and to understand the relative contribution of each, for specific diseases and for specific groups. The paper below, newly published in PLoS Medicine gives us insight into another potential environmental contributor to health disparities between majority and minority groups in England. Doctors are more likely to be of a different ethnicity than their minority patients, and this can create problems in communication and optimal health care delivery to ethnic minorities
Professional Uncertainty and Disempowerment Responding to Ethnic Diversity in Health Care: A Qualitative Study
Joe Kai, Jackie Beavan, Christina Faull, Lynne Dodson, Paramjit Gill, Angela Beighton
PLoS Medicine 4(11): e323
Professional Uncertainty and Disempowerment Responding to Ethnic Diversity in Health Care: A Qualitative Study
Joe Kai, Jackie Beavan, Christina Faull, Lynne Dodson, Paramjit Gill, Angela Beighton
PLoS Medicine 4(11): e323
Background While ethnic disparities in health and health care are increasing, evidence on how to enhance quality of care and reduce inequalities remains limited. Despite growth in the scope and application of guidelines on “cultural competence,” remarkably little is known about how practising health professionals experience and perceive their work with patients from diverse ethnic communities. Using cancer care as a clinical context, we aimed to explore this with a range of health professionals to inform interventions to enhance quality of care.
Methods and Findings We conducted a qualitative study involving 18 focus groups with a purposeful sample of 106 health professionals of differing disciplines, in primary and secondary care settings, working with patient populations of varying ethnic diversity in the Midlands of the UK. Data were analysed by constant comparison and we undertook processes for validation of analysis. We found that, as they sought to offer appropriate care, health professionals wrestled with considerable uncertainty and apprehension in responding to the needs of patients of ethnicities different from their own. They emphasised their perceived ignorance about cultural difference and were anxious about being culturally inappropriate, causing affront, or appearing discriminatory or racist. Professionals' ability to think and act flexibly or creatively faltered. Although trying to do their best, professionals' uncertainty was disempowering, creating a disabling hesitancy and inertia in their practice. Most professionals sought and applied a knowledge-based cultural expertise approach to patients, though some identified the risk of engendering stereotypical expectations of patients. Professionals' uncertainty and disempowerment had the potential to perpetuate each other, to the detriment of patient care.
Conclusions This study suggests potential mechanisms by which health professionals may inadvertently contribute to ethnic disparities in health care. It identifies critical opportunities to empower health professionals to respond more effectively. Interventions should help professionals acknowledge their uncertainty and its potential to create inertia in their practice. A shift away from a cultural expertise model toward a greater focus on each patient as an individual may help.
Monday, November 26, 2007
Huge study on the population genetics of Native Americans
This is a pretty impressive study. They analyzed "678 autosomal microsatellite markers genotyped in 422 individuals" spread across the Americas. They also compare it to the CEPH panel of worldwide populations
Interestingly, or ironically, there are no samples from populations living in the United States. The authors claim that their study "represents the largest continent-wide Native American population-genetic study performed to date". I like the fact that they use the data to examine several of the main hypotheses regarding Native American population genetics. They include 2o figures and 30 or so tables in the supplementary material!! They don't seem to find anything too surprising...
Genetic variation and Population Structure in Native Americans
Sijia Wang, Cecil M. Lewis Jr., et al.
PLoS Genetics 3(11): e185
Abstract: We examined genetic diversity and population structure in the American landmass using 678 autosomal microsatellite markers genotyped in 422 individuals representing 24 Native American populations sampled from North, Central, and South America. These data were analyzed jointly with similar data available in 54 other indigenous populations worldwide, including an additional five Native American groups. The Native American populations have lower genetic diversity and greater differentiation than populations from other continental regions. We observe gradients both of decreasing genetic diversity as a function of geographic distance from the Bering Strait and of decreasing genetic similarity to Siberians—signals of the southward dispersal of human populations from the northwestern tip of the Americas. We also observe evidence of: (1) a higher level of diversity and lower level of population structure in western South America compared to eastern South America, (2) a relative lack of differentiation between Mesoamerican and Andean populations, (3) a scenario in which coastal routes were easier for migrating peoples to traverse in comparison with inland routes, and (4) a partial agreement on a local scale between genetic similarity and the linguistic classification of populations. These findings offer new insights into the process of population dispersal and differentiation during the peopling of the Americas.
Thursday, November 22, 2007
Genetic Admixture, and SES in Venezuela
They use very few markers, but they find some interesting, albeit expected differences in admixture between high and low SES groups. Admixture estimates for Caracas, Venezuela, based on autosomal, Y-chromosome, and mtDNA markers.
Martínez H, Rodríguez-Larralde A, Izaguirre MH, De Guerra DC
Hum Biol. 2007 Apr;79(2):201-13.
Martínez H, Rodríguez-Larralde A, Izaguirre MH, De Guerra DC
Hum Biol. 2007 Apr;79(2):201-13.
Abstract: The present Venezuelan population is the product of admixture of Amerindians, Europeans, and Africans, a process that was not homogeneous throughout the country. Blood groups, short tandem repeats (STRs), mtDNA, and Y-chromosome markers have been used successfully in admixture studies, but few such studies have been conducted in Venezuela. In this study we aim to estimate the admixture components of samples from two different socioeconomic levels from Caracas, Venezuela's capital city, compare their differences, and infer sexual asymmetry in the European Amerindian union patterns. Gene frequencies for blood groups ABO and Rh (CDE) and for the STRs VWA, F13A01, and FES/FPS and mtDNA and Y-chromosome haplogroups were studied in a sample of 60 individuals living in Caracas, taken from a private clinic (high socioeconomic level), and 50 individuals, also living in Caracas, drawn from a public maternity clinic (low socioeconomic level). The admixture analysis for the five autosomal markers gives a high European component (0.78) and an almost negligible African sub-Saharan component (0.06) for the high socioeconomic level, whereas for the low socioeconomic level the sub-Saharan, European, and Amerindian components were 0.21, 0.42, and 0.36, respectively. Estimates of admixture based on mtDNA and Y-chromosome markers reveal that the Amerindian contribution to these Caracas samples is almost entirely through females, because the Y-chromosome Amerindian and African sub-Saharan chromosomes found in this study were scarce. Our study reveals that the identification of the grandparents' geographic origin is an important methodological aspect to take into account in genetic studies related to the reconstruction of historical events.
Monday, November 19, 2007
The sickle cell gene's recent introgression into East Africa
This is a "Short Report" and it is indeed very short! It seems like they assume that patterns of mt-DNA and Y-chromosome diversity are not subject to forces of selection and just represent neutral "population-level forces". I wonder how safe this assumption is? Here is the basis of their test:
By typing both the haploid Y chromosome and the S gene in the same samples it should be possible to test for common demography as well as detect affinities of particular S variants observed in Sudan to other regions of Africa.their conclusion:
Our results suggest that the sickle cell gene may have been preferentially introduced through males of migrating west African tribes (Figure 1), particularly Hausa-Fulani, and Bagara in the large migrations that began in the eighteenth century and escalated during the nineteenth and early twentieth century. The estimates of a recent figure of 1–3 generations for the introduction of the gene and associated haplotypes to eastern Sahel, is consistent with demography during the past 100 years and with a hypothesis of a recent origin of malaria as a major human infection."recent origin of malaria as a major human infection" - hmm...interesting!
Co-introgression of Y-chromosome haplogroups and the sickle cell gene across Africa's Sahel
Rihab E Bereir, Hisham Y Hassan, Niven A Salih, Peter A Underhill, Luigi L Cavalli-Sforza, Ayman A Hussain, Dominic Kwiatkowski and Muntaser E Ibrahim
European Journal of Human Genetics (2007) 15, 1183–1185;
Abstract: The Sahel that extends from the Atlantic Ocean to the Ethiopian highland is a historical reservoir of Africa's cultures and grandest populations and a known arena of ancient and recent migrations. We are interested in the issue whether such migrations were also carriers of genetic traits and whether this introgression could be associated with population genetic markers. Based on analysis of Y-chromosome haplogroups, we present evidence that the sickle gene, one of the major protective polymorphisms known in malaria, has in fact found its way only recently to the gene pool of the populations in eastern Sahel. We discuss the possible dynamics of the process and give estimates of the age of the introduction of the S allele into eastern Sahel.
Saturday, November 17, 2007
Genetic influence on hypertension differences between African and European Americans
In this large scale admixture scan, they don't find evidence for an effect of genetic differences between Africans and Europeans on hypertension risk. They discuss the implications in that the incidence disparity between African Americans and European Americans may be due more to the effects of the environment, but they also discuss some of the limitations of their study.
Interestingly they look at the effects of loci that were proposed to have an effect in an earlier study:
Rahul C. Deo, Nick Patterson, Arti Tandon, Gavin J. McDonald, Christopher A. Haiman, Kristin Ardlie, Brian E. Henderson, Sean O. Henderson, David Reich
PLoS Genetics 3(11): e196
Interestingly they look at the effects of loci that were proposed to have an effect in an earlier study:
We also examined five candidate genes that were highlighted by Young et al. [3], who proposed that HTN may arise from the interaction of salt-availability in humans populations with heat-adapted alleles that vary widely in frequency across populations. None of the five genes produced an admixture signal, suggesting that the underlying alleles do not explain a substantial amount of differential HTN risk across these populations.This earlier study, also in PLoS Genetics, suggests that:
... the current epidemic of hypertension is due to exposures of the modern period interacting with ancestral susceptibility. Modern populations differ in susceptibility to these new exposures, however, such that those from hot environments are more susceptible to hypertension than populations from cold environments. This differential susceptibility is likely due to our history of adaptation to climate.High-Density Admixture Scan in 1,670 African Americans with Hypertension
Rahul C. Deo, Nick Patterson, Arti Tandon, Gavin J. McDonald, Christopher A. Haiman, Kristin Ardlie, Brian E. Henderson, Sean O. Henderson, David Reich
PLoS Genetics 3(11): e196
Author Summary: Hypertension (HTN) is a devastating disease with a higher incidence in African Americans than European Americans, inspiring searches for genetic variants that contribute to this difference. We report the results of a large-scale admixture scan for genes contributing HTN risk, in which we screened 1,670 African Americans with HTN and 387 control individuals for regions of the genome with elevated proportion of African or European ancestry. No loci were identified that were significantly associated with HTN. We also searched for evidence of an admixture signal at 40 candidate genes and eight previously reported linkage peaks, but none appears to contribute substantially to the differential HTN risk between African and European Americans. Finally, we observed nominal association at one of the loci detected in the admixture scan of Zhu et al. 2005 (p = 0.016 at 6q24.3 correcting for four hypotheses tested), although we caution that the significance is marginal and the estimated odds ratio of 1.19 per African allele is less than what would be expected from the original report; thus, further work is needed to follow up this locus.
Friday, November 16, 2007
Disease associations differ between ethnic groups - within Europe?
The finding here is that Germans and Serbs differ in the association between a haplotype in the MAPT gene and Parkinson's disease. Previous studies had shown different associations within this gene with PD between Norwegians and Greeks. Here they look at whether there's a difference along a similar North vs. South European geographical spectrum - Germans and Serbs - a much narrower spectrum, at that.
One annoying thing about this paper is their use of the term "ethnical".
It's surprising to me that they find this difference between groups that are geographically so close, and I'm not too sure how to interpret their statement that their power is 80%.
Role of ethnicity on the association of MAPT H1 haplotypes and subhaplotypes in Parkinson's disease
Susan Winkler, Inke R König, Katja Lohmann-Hedrich, Peter Vieregge, Vladimir Kostic and Christine Klein
European Journal of Human Genetics (2007) 15, 1163–1168
Abstract: An association of the H1 haplotype and subhaplotypes in the microtubule-associated protein Tau (MAPT) gene with Parkinson's disease (PD) has been reported. To further evaluate their role in PD, we genotyped a sample set of 765 cases and controls consisting of two large European subgroups of German (n=418) and Serbian (n=347) origin for the MAPT haplotypes H1 and H2. The H1/H1 carriers were tested for three additional MAPT polymorphisms. In the Serbian sample, there was significant evidence (P=0.0108) of an association of the H1/H1 genotype and PD. Surprisingly, in the German sample, we did not find significant differences in genotype or haplotype frequencies between patients and controls. These results suggest that the role of H1 haplotypes in the etiology of PD may be ethnically dependent.
Wednesday, November 14, 2007
Recent revisions regarding how the genome works
Via TAMU Anthropology in the News, I found this article from the Washington Post by David Brown called How Science is Rewriting the Book on Genes that gives an update on why things that were once thought to be rules in genetics are turning out not to be so cut and dry. Many of these are pretty well known.
- A gene can code for many proteins, not just one, through alternative splicing
- The regulation of genes might contribute more than previously thought to evolutionary change than the actual content of the genes:
"Nearly 1 in 10 (genes) code for transcription factors, proteins that help turn genes on and off at the right time."He discusses conserved, non-coding elements and says this:
"A study in the journal Science in August found that these elements are less tolerant of mutation than protein-coding genes. That means they are more likely to be identical among people, mice, fruit flies and worms than are the genes coding for proteins. It turns out that more of evolution's survival-of-the-fittest battles occurred in writing the instruction manual for running the genes than in designing the genes themselves."However, as a side note, there was another recent study (see here) that found little effect of removing ultraconserved non-coding elements from mice, in that it did not visibly or immediately affect their viability, suggesting as the authors put it "...that extreme sequence constraint does not necessarily reflect crucial functions required for viability"
- Synonymous mutations are not as inconsequential as previously thought (see here)
- There is a premium placed on an organisms being able to quickly and efficiently mitigate the effects of an unpredictable environment:
"When a cell is translating a piece of mRNA into a protein, it stops when it reaches a three-nucleotide segment called a termination codon that causes the just-built protein chain to separate from the construction machinery -- like a car rolling off the assembly line. It now turns out that the mRNA instructions for a few proteins have a termination codon in the middle of the chain, not just at the end.
The protein-building machinery can sometimes "read through" this instruction and complete the protein. (How it does that is complicated and only partially understood). But most of the time, construction just stops. The half-finished protein is broken down, and all the effort goes for naught.
Why would an organism have an assembly line that builds a product partway and then tears it up time after time? This may be another strategy that allows the body to handle certain problems at a moment's notice."
I guess the bottom line here is that we're making slow progress towards understanding the genome,... or that "the more we know, the less we know".
Sunday, November 11, 2007
"Racial" Self Classification, African genetic ancestry, and GST polymorphisms
 First, using about 40 AIMs (ancestry informative markers) and the STRUCTURE program, they come up with AF, EU, and NA admixture proportions. They look at how these proportions differ based on self-classification (White, Black, Intermediate). They also type some GST polymorphisms. These are known to be pharmacologically important in that they encode the phase 2 drug metabolizing enzymes, and are known to differ in frequency between populations.
- Most interestingly, when they analyze the association of AF ancestry (ACA) and the different polymorphisms they find a threshold effect for some of them:
This approach disclosed significant associations of the GSTM1-null and the GSTM3*B polymorphisms with the proportion in African ancestry, throughout the range of ACAs observed in the study population (0.13–0.95). Importantly, a threshold proportion of the African component of ancestry was detected at approximately 0.4, above which the frequency of the polymorphisms shows a monotonic dependence on the ACA. This range encompasses 61% of the overall population sample, representing 87.5% of Blacks, 70.3% of Intermediates but only 8.8% of self-identified Whites.
- I wish they would have discussed or interpreted this finding a bit more.
- Self-reported skin color, genomic ancestry and the distribution of GST polymorphisms.
- Suarez-Kurtz G, Vargens DD, Struchiner CJ, Bastos-Rodrigues L, Pena SD.
Background and objective: Skin color and self-reported ethnicity have systematically been used in the pharmacogenetic/-genomic literature as phenotypic proxies for geographical ancestry. Population admixture, however, challenges the appropriateness of this approach. We compared the effectiveness of color-based and marker-based biogeographical ancestry classifications in typing polymorphisms in GSTM1, GSTM3 and GSTT1 in the heterogeneous Brazilian population.
Methods: Individual DNA from 335 healthy Brazilians was typed for a set of insertion/deletion polymorphisms, previously validated as ancestry informative markers. GSTM1-null and GSTT1-null polymorphisms were detected by multiplex PCR and the GSTM3*B polymorphism by restriction-fragment length polymorphism. Nonlinear logistic regression modeling was developed to describe the association between the GST polymorphisms and ancestry estimated by the ancestry informative markers.
Results: Analysis of the ancestry informative markers data with the Structure software revealed the existence of only two significant clusters, one of which was inferred to be an estimate of the African component of ancestry. Nonlinear logistic regression showed that the odds of having the GSTM1-null genotype decreases (P less than 0.0004, Wald statistics), whereas the odds of having the GSTM3*B allele increases (P less than 0.0001) with the increase of the African component of ancestry, throughout the range (0.13-0.95) observed in the population sample. The African component of ancestry proportion was not associated with GSTT1-null frequency. Within the self-reported Black and Intermediate groups, there were significant differences in ancestry informative markers between GSTM1-null and non-null individuals, and between carriers and noncarriers of the GSTM3*B allele.
Conclusions: Interethnic admixture is a source of cryptic population structure that may lead to spurious genotype-phenotype associations in pharmacogenetic/-genomic studies. Logistic regression modeling of GST polymorphisms shows that admixture must be dealt with as a continuous variable, rather than proportioned in arbitrary subcategories for the convenience of data quantification and analysis.
Thursday, November 08, 2007
Out of Africa with or without assimilation?
This one finds more evidence for Out of Africa, with replacement and no funny business. This debate seems endless, but it is interesting. I'd have to say that the overall picture of the evidence so far points mostly to Out of Africa with little to very little assimilation. The scenario presented in this paper seems a bit extreme, but nonetheless important to consider.
Statistical evaluation of alternative models of human evolution
Nelson J. R. Fagundes, Nicolas Ray, Mark Beaumont, Samuel Neuenschwander, Francisco M. Salzano, Sandro L. Bonatto, and Laurent Excoffier
PNAS Published online before print October 31, 2007
Statistical evaluation of alternative models of human evolution
Nelson J. R. Fagundes, Nicolas Ray, Mark Beaumont, Samuel Neuenschwander, Francisco M. Salzano, Sandro L. Bonatto, and Laurent Excoffier
PNAS Published online before print October 31, 2007
Abstract: An appropriate model of recent human evolution is not only important to understand our own history, but it is necessary to disentangle the effects of demography and selection on genome diversity. Although most genetic data support the view that our species originated recently in Africa, it is still unclear if it completely replaced former members of the Homo genus, or if some interbreeding occurred during its range expansion. Several scenarios of modern human evolution have been proposed on the basis of molecular and paleontological data, but their likelihood has never been statistically assessed. Using DNA data from 50 nuclear loci sequenced in African, Asian and Native American samples, we show here by extensive simulations that a simple African replacement model with exponential growth has a higher probability (78%) as compared with alternative multiregional evolution or assimilation scenarios. A Bayesian analysis of the data under this best supported model points to an origin of our species 141 thousand years ago (Kya), an exit out-of-Africa 51 Kya, and a recent colonization of the Americas 10.5 Kya. We also find that the African replacement model explains not only the shallow ancestry of mtDNA or Y-chromosomes but also the occurrence of deep lineages at some autosomal loci, which has been formerly interpreted as a sign of interbreeding with Homo erectus.
Wednesday, November 07, 2007
ACTN3 in West vs. East African Athletes
 It's nice to see negative results like this one published. Some studies have found associations between this ACTN3 allele and endurance vs. sprint performance (here), but only Europeans have been looked at so far (although I thought they did a study on Kenyans before). We also know that the "endurance" version of this allele (X) is at a higher frequency outside of Africa (here). In this study they look for an association between West African controls vs. "sprint" athletes and Kenyan and Ethiopian controls vs. endurance athletes.
the discussion is short and sweet, and they offer some alternative scenarios (abstract is further below):
The X allele has been observed in all human populations tested so far. The lowest X allele frequencies occur in Kenyan, Nigerian and South African populations (8-11%), resulting in approximately 1% XX genotype frequency. Australian Caucasian and Spanish with European origin, Japanese in northeast Asia, and Javanese in southeast Asia have the highest frequencies of the X allele (44-54%), resulting in XX genotype frequencies from 18 to 25%. The X allele frequencies in the Japanese and Javanese populations are higher than 50%. Papua New Guinea highlanders and Aboriginal Australians display intermediate X allele frequencies (29-36%), resulting in XX genotype frequencies of 10-15% (11).The ACTN3 R577X Polymorphism in East and West African Athletes
This study does not support the hypothesis that the ACTN3 null X allele contributes to the success of the East African endurance runners relative to their source populations. In addition, the extremely low XX genotype frequency in the Nigerian control population (0% in this study) rules out the possibility of detecting a lower frequency of the XX genotype in Nigerian power athletes.
There are several possible explanations for the discrepancy between these results and previously published associations seen in athletes of European descent. The low baseline allele frequency of 577X in the three surveyed African populations reduces the effective power of our study, potentially obscuring any genetic association with performance. Alternately, it is possible that the effect of ACTN3 genotype on muscle performance is dependent on other genetic influences, or on environmental variables, that differ between African and non-African populations. For example, many East Africans are subject to environmental influences, such as living and training at altitude and high levels of incidental running during childhood, which play major roles in shaping athletes from this region (12,15) and differ substantially from the childhood experiences of most potential non-African athletes. Such factors may reduce the impact of [alpha]-actinin-3 deficiency on the muscle performance of African individuals.
In conclusion, the results of this study extend our knowledge of the distribution of the 577X null allele of the ACTN3 gene to three previously unexamined African populations. We have shown that the frequency of the 577X allele is substantially lower in Kenyan and Nigerian populations than in any non-African population sampled to date, and it is similar to that seen previously in a South African Bantu-speaking cohort (Table 1) (7). The 577X allele frequency seen in the Ethiopian group is substantially higher, probably reflecting population admixture with non-African groups. We have found no evidence for an association between the R577X polymorphism and endurance performance in East African athletes. The absence of 577XX ([alpha]-actinin-3 deficiency) in controls and athletes from Nigeria would mask any association between the presence of [alpha]-actinin-3 and sprint/power performance. Our data suggest that [alpha]-actinin-3 deficiency is not a major influence on performance in African athletes.
YANG, NAN; MACARTHUR, DANIEL G.; WOLDE, BEZABHE; ONYWERA, VINCENT O.; BOIT, MICHAEL K.; LAU, SAU YIN MARY-ANN; WILSON, RICHARD H.; SCOTT, ROBERT A.; PITSILADIS, YANNIS P.; NORTH, KATHRYN
Medicine & Science in Sports & Exercise. 39(11):1985-1988, November 2007.
Purpose: To determine the frequency of the ACTN3 R577X polymorphism (functional R allele and nonfunctional X allele) in a variety of African populations and to examine its influence on the success of elite East African endurance runners and West African sprinters.Methods: The R577X polymorphism was genotyped in 198 Ethiopian controls and 76 elite Ethiopian endurance athletes, 158 Kenyan controls and 284 elite Kenyan endurance runners, and 60 Nigerian controls and 62 elite Nigerian power athletes. Statistical analyses were performed by exact tests of population differentiation, using Arlequin, version 3. Analyses were carried out using 1 × 10⁶ Markov chain steps, and 1 × 10⁵ dememorization steps.
Results: The frequency of the X allele was extremely low among Kenyans and Nigerians (~1% homozygosity) and higher in Ethiopians (~11% homozygosity). The low baseline frequencies of the three populations tested mean that any associations with sprint performance would likely be obscured. In Ethiopians, where baseline levels of 577XX were about 11%, there was no increased frequency in the endurance athletes.
Conclusion: Our data suggest that [alpha]-actinin-3 deficiency is not a major influence on performance in African athletes.
Tuesday, November 06, 2007
PNG population genetics
First some background on the populations in PNG and the surrounding area:
Patterns of Y-Chromosome Diversity Intersect with the Trans-New Guinea Hypothesis
Stefano Mona, Mila Tommaseo-Ponzetta, Silke Brauer, Herawati Sudoyo, Sangkot Marzuki and Manfred Kayser
Molecular Biology and Evolution 2007 24(11):2546-2555
The island of New Guinea is interesting for studying human genetic history because it was occupied by anatomically modern humans as long as 35–40,000 years ago (Groube et al. 1986; Pavlides and Gosden 1994; Leavesley et al. 2002; Specht 2005) representing part of the first expansion of modern humans out of Africa. Melanesia (used here as geographic term comprising mainland New Guinea and surrounding islands in the north and east, also referred to as Near Oceania together with most of the Solomon islands) is inhabited today by speakers of 2 kinds of languages. Austronesian-speaking groups have a common ancestral language, Proto-Austronesian, and mostly live on islands around New Guinea as well as on the northeast and southeast coasts of the New Guinea mainland. Non-Austronesian (=Papuan)–speaking groups lack a (recent) common ancestry and include numerous linguistically unrelated groups. Papuan speakers dominate the New Guinea mainland, living inland from Austronesian speakers where such are present, and are also found in a few places around the islands north, northeast, and east of mainland New Guinea where their languages have persisted to modern times (Wurm and Hattori 1981; Specht 2005). These 2 groups of people have a different history in Melanesia: non-Austronesian–speaking groups reflecting the ebb and flow of language that emerged out of the Pleistocene language geography, whereas Austronesian speakers arrived as migrants from East Asia not earlier than 3,500 years ago (Kirch 1997).What is the Trans-New Guinea hypothesis?
The genetic history of the New Guinea area prior to the arrival of Austronesian speakers has only recently begun to receive attention. The Trans-New Guinea (TNG) hypothesis proposes a very large family of languages mostly spoken along the central cordillera of New Guinea and in some regions north and south of the cordillera, with outliers in the Timor area of Island Southeast Asia. The TNG hypothesis implies an expansion of people speaking TNG languages started about 6,000–7,000 (perhaps as early as 10,000) years ago in the central highlands of what is now Papua New Guinea (PNG), most likely in connection with the expansion of agriculture, and spread both eastwards and westwards (Pawley 1998; Denham et al. 2003; Pawley 2005)What they conlcude:
It is likely that the expansion of TNG speakers starting from the highlands of what is now PNG about 6,000–7,000 (perhaps as early as 10,000) years ago, presumably in association with the expansion of agriculture, had a great impact on shaping New Guinean Y-chromosome diversity as seen today.and
We propose that sex-biased differences in the social structure and cultural heritage of the people involved in the 2 different expansions played an important role (among other factors) in shaping the New Guinean Y-chromosome landscape.I wish I had more time to look at this paper more closely, because it seems to highlight both the genetic and cultural aspects of population dynamics.
Patterns of Y-Chromosome Diversity Intersect with the Trans-New Guinea Hypothesis
Stefano Mona, Mila Tommaseo-Ponzetta, Silke Brauer, Herawati Sudoyo, Sangkot Marzuki and Manfred Kayser
Molecular Biology and Evolution 2007 24(11):2546-2555
The island of New Guinea received part of the first human expansion out of Africa (>40,000 years ago), but its human genetic history remains poorly understood. In this study, we examined Y-chromosome diversity in 162 samples from the Bird's Head region of northwest New Guinea (NWNG) and compared the results with previously obtained data from other parts of the island. NWNG harbors a high level of cultural and linguistic diversity and is inhabited by non-Austronesian (i.e., Papuan)–speaking groups as well as harboring most of West New Guinea's (WNG) Austronesian-speaking groups. However, 97.5% of its Y-chromosomes belong to 5 haplogroups that originated in Melanesia; hence, the Y-chromosome diversity of NWNG (and, according to available data, of New Guinea as a whole) essentially reflects a local history. The remaining 2.5% belong to 2 haplogroups (O-M119 and O-M122) of East Asian origin, which were brought to New Guinea by Austronesian-speaking migrants around 3,500 years ago. Thus, the Austronesian expansion had only a small impact on shaping Y-chromosome diversity in NWNG, although the linguistic impact of this expansion to this region was much higher. In contrast, the expansion of Trans-New Guinea (TNG) speakers (non-Austronesian) starting about 6,000–10,000 years ago from the central highlands of what is now Papua New Guinea, presumably in combination with the expansion of agriculture, played a more important role in determining the Y-chromosome diversity of New Guinea. In particular, we identified 2 haplogroups (M-P34 and K-M254) as suggestive markers for the TNG expansion, whereas 2 other haplogroups (C-M38 and K-M9) most likely reflect the earlier local Y-chromosome diversity. We propose that sex-biased differences in the social structure and cultural heritage of the people involved in the Austronesian and the TNG expansions played an important role (among other factors) in shaping the New Guinean Y-chromosome landscape.
Monday, November 05, 2007
OCA2 and eye color
 OCA2 and other genes have previously been implicated in eye color (here, here, and a new paper that I haven't blogged on yet) Here, they look at more variants in OCA2 and are able to predict eye color from a "modest number of SNPs in the gene."
Multilocus OCA2 genotypes specify human iris colors
Tony Frudakis, Timothy Terravainen and Matthew Thomas
Human Genetics Volume 122, Numbers 3-4 / November, 2007
Human iris color is a quantitative, multifactorial phenotype that exhibits quasi-Mendelian inheritance. Recent studies have shown that OCA2 polymorphism underlies most of the natural variability in human iris pigmentation but to date, only a few associated polymorphisms in this gene have been described. Herein, we describe an iris color score (C) for quantifying iris melanin content in-silico and undertake a more detailed survey of the OCA2 locus (n = 271 SNPs). In 1,317 subjects, we confirmed six previously described associations and identified another 27 strongly associated with C that were not explained by continental population stratification (OR 1.5–17.9, P = 0.03 to less than 0.001). Haplotype analysis with respect to these 33 SNPs revealed six haplotype blocks and 11 hap-tags within these blocks. To identify genetic features for best-predicting iris color, we selected sets of SNPs by parsing P values among possible combinations and identified four discontinuous and non-overlapping sets across the LD blocks (p-Selected SNP sets). In a second, partially overlapping sample of 1,072, samples with matching diplotypes comprised of these p-Selected OCA2 SNPs exhibited a rate of C concordance of 96.3% (n = 82), which was significantly greater than that obtained from randomly selected samples (62.6%, n = 246, P less than 0.0001). In contrast, the rate of C concordance using diplotypes comprised of the 11 identified hap-tags was only 83.7%, and that obtained using diplotypes comprised of all 33 SNPs organized as contiguous sets along the locus (defined by the LD block structure) was only 93.3%. These results confirm that OCA2 is the major human iris color gene and suggest that using an empirical database-driven system, genotypes from a modest number of SNPs within this gene can be used to accurately predict iris melanin content from DNA.
Sunday, November 04, 2007
Recombination hotspot variation across populations
They find some interesting and strong population differences in recombination rates, but don't really give any clues as to any possible explanations other than:
Jan Graffelman, David J. Balding, Anna Gonzalez-Neira and Jaume Bertranpetit
Human Genetics Volume 122, Numbers 3-4 / November, 2007
Differences in recombination rates and presence or absence of hotspots may follow a more complex pattern related to the genetic diversity among humans due to their evolutionary history and its impact on the DNA sequences, that may be at the base of differences in recombination rates.Variation in estimated recombination rates across human populations
Jan Graffelman, David J. Balding, Anna Gonzalez-Neira and Jaume Bertranpetit
Human Genetics Volume 122, Numbers 3-4 / November, 2007
Abstract: Recently it has been reported that recombination hotspots appear to be highly variable between humans and chimpanzees, and there is evidence for between-person variability in hotspots, and evolutionary transience. To understand the nature of variation in human recombination rates, it is important to describe patterns of variability across populations. Direct measurement of recombination rates remains infeasible on a large scale, and population-genetic approaches can be imprecise, and are affected by demographic history. Reports to date have suggested broad similarity in recombination rates at large genomic scales and across human populations. Here, we examine recombination rate estimates at a finer population and genomic scale: 28 worldwide populations and 107 SNPs in a 1 Mb stretch of chromosome 22q. We employ analysis of variance of recombination rate estimates, corrected for differences in effective population size using genome-wide microsatellite mutation rate estimates. We find substantial variation in fine-scale rates between populations, but reduced variation within continental groups. All effects examined (SNP-pair, region, population and interactions) were highly significant. Adjustment for effective population size made little difference to the conclusions. Observed hotspots tended to be conserved across populations, albeit at varying intensities. This holds particularly for populations from the same region, and also to a considerable degree across geographical regions. However, some hotspots appear to be population-specific. Several results from studies on the population history of humans are in accordance with our analysis. Our results suggest that between-population variation in DNA sequences may underly recombination rate variation.
Friday, November 02, 2007
EDAR and thick hair in East Asians
Razib picked up on a news story in Science about a study finding an association between hair thickness and alleles of EDAR. They did this in Southeast Asia where there was some variation in hair thickness.
East Asians have hair fibers that are 30% larger than that of Africans and 50% larger than that of Europeans. I guess the publication will show up later.
East Asians have hair fibers that are 30% larger than that of Africans and 50% larger than that of Europeans. I guess the publication will show up later.
Thursday, November 01, 2007
Ten rules for doing your best research
PLoS likes these top ten lists. Here's one from PLoS Computational Biology, that is taken from mathematician Richard Hamming's talk some 20 years ago. I don't really understand Rule 1 (it may apply in the 80s, but not so much anymore?). Rule #3 is very interesting. Beyond that, rules # 4, 7, and 10, are my favorites.
Rule 1: Drop Modesty
To quote Hamming: “Say to yourself: ‘Yes, I would like to do first-class work.' Our society frowns on people who set out to do really good work. But you should say to yourself: ‘Yes, I would like to do something significant.'”
Rule 2: Prepare Your Mind
Many think that great science is the result of good luck, but luck is nothing but the marriage of opportunity and preparation. Hamming cites Pasteur's adage that “luck favours the prepared mind.”
Rule 3: Age Is Important
Einstein did things very early, and all the “quantum mechanic fellows,” as well as most mathematicians and astrophysicists, were, as Hamming notes, “disgustingly young” when they did their best work. On the other hand, in the fields of music, politics, and literature, the protagonists often produce what we consider their best work late in life.
Rule 4: Brains Are Not Enough, You Also Need Courage
Great scientists have more than just brainpower. To again cite Hamming: “Once you get your courage up and believe that you can do important things, then you can. If you think you can't, almost surely you are not going to. Great scientists will go forward under incredible circumstances; they think and continue to think.”
Rule 5: Make the Best of Your Working Conditions
To paraphrase Hamming, what most people think are the best working conditions clearly are not, because people are often most productive when working conditions are bad. One of the better times of the Cambridge Physical Laboratories was when they worked practically in shacks—they did some of the best physics ever. By turning the problem around a bit, great scientists often transform an apparent defect into an asset. “It is a poor workman who blames his tools—the good man gets on with the job, given what he's got, and gets the best answer he can.”
Rule 6: Work Hard and Effectively
Most great scientists have tremendous drive, and most of us would be surprised how much we would know if we worked as hard as some great scientists did for many years. As Hamming says: “Knowledge and productivity are like compound interest. Given two people with exactly the same ability, the one person who manages day in and day out to get in one more hour of thinking will be tremendously more productive over a lifetime.” But, Hamming notes, hard work alone is not enough—it must be applied sensibly.
Rule 7: Believe and Doubt Your Hypothesis at the Same Time
Great scientists tolerate ambiguity. They believe the theory enough to go ahead; they doubt it enough to notice the errors and faults so they can step forward and create the new replacement theory. As Hamming says: “When you find apparent flaws, you've got to be sensitive and keep track of those things, and keep an eye out for how they can be explained or how the theory can be changed to fit them. Those are often the great scientific contributions.”
Rule 8: Work on the Important Problems in Your Field
It is surprising but true that the average scientist spends almost all his time working on problems that he believes not to be important and not to be likely to lead to important results. By contrast, those seeking to do great work must ask: “What are the important problems of my field? What important problems am I working on?” Hamming again: “It's that simple. If you want to do great work, you clearly must work on important problems. . . . I finally adopted what I called ‘Great Thoughts Time.' When I went to lunch Friday noon, I would only discuss great thoughts after that. By great thoughts I mean ones like: ‘What will be the impact of computers on science and how can I change it?'”
Rule 9: Be Committed to Your Problem
Scientists who are not fully committed to their problem seldom produce first-class work. To a large extent, creativity comes out of the subconscious. If you are deeply immersed in and committed to a topic, day after day, your subconscious has nothing to do but work on your problem. Hamming says it best: “So the way to manage yourself is that when you have a real important problem you don't let anything else get the center of your attention—you keep your thoughts on the problem. Keep your subconscious starved so it has to work on your problem, so you can sleep peacefully and get the answer in the morning, free.”
Rule 10: Leave Your Door Open
Keeping the door to your office closed makes you more productive in the short term. But ten years later, somehow you may not quite know what problems are worth working on, and all the hard work you do will be “sort of tangential” in importance. He (or she) who leaves the door open gets all kinds of interruptions, but he (or she) also occasionally gets clues as to what the world is and what might be important. Again, Hamming deserves to be quoted verbatim: “There is a pretty good correlation between those who work with the doors open and those who ultimately do important things, although people who work with doors closed often work harder. Somehow they seem to work on slightly the wrong thing—not much, but enough that they miss fame.”
In our view, Rule 10 may be the key to getting the best research done because it will help you to obey Rules 1–9, and, most importantly, it will foster group creativity [9]. A discussion over lunch with your colleagues is often worth much more than a trip to the library. However, when choosing your lunchmates (and, by implication, your institution), be on your toes. As Hamming says: “When you talk to other people, you want to get rid of those sound absorbers who are nice people but merely say ‘Oh yes,' and to find those who will stimulate you right back.”
Monday, October 29, 2007
Genomewide association of skin color in South Asians
I liked this paper quite a lot. It looked at natural variation in skin color among people from South Asia. (see abstract below)
What they did is looked at 1.6 million SNPs in the individuals in the top 20% of skin darkness versus individuals in the bottom 20% in skin darkness.
Razib has an extensive post on this paper. I'm going to follow the FAQ format that John Hawks sometimes uses (only two questions here, though):
Why this is new and exciting?
According to the authors this is the first genome wide association study on skin pigmentation They focus on subjects who come from a somewhat localized population or set of populations (India, Pakistan, Bangladesh, Sri Lanka), but that have a wide range of skin darkness. One potential caveat is that the subjects live in the UK, thereby minimizing degree of skin darkness, especially given that the researchers use points of measurement that are not all that sun-hidden (forearm and just above the elbow).
So what does it say about the genetics of skin color?
They find the usual suspects (TYR, SLC24A5, and SLC45A2). This can be surprising or unsurprising depending on how you look at it. First it highlights that the effect of SLC24A5 (associated with light skin color in Europeans but not Asians) extends all the way to South Asia. This could be interpreted in several ways. The fact that they find only three genes with strong associations is intriguing, and the fact that SLC24A5 accounts for 30% of skin color variation confirms earlier studies and may highlight once again that skin color may not be controlled by all that many loci... Although, the authors mention that this is likely an underestimate because of reduced power due to the Bonferroni correction.
Lastly, they also state that the "contributions of these polymorphisms to skin pigmentation were found to be independent and additive across genes,"
A Genomewide Association Study of Skin Pigmentation in a South Asian Population
Renee P. Stokowski, P. V. Krishna Pant, Tony Dadd, Amelia Fereday, David A. Hinds, Carl Jarman, Wendy Filsell, Rebecca S. Ginger, Martin R. Green, Frans J. van der Ouderaa, and David R. Cox
The American Journal of Human Genetics, volume 81 (2007), page 000
We have conducted a multistage genomewide association study, using 1,620,742 single-nucleotide polymorphisms to systematically investigate the genetic factors influencing intrinsic skin pigmentation in a population of South Asian descent. Polymorphisms in three genes SLC24A5, TYR, and SLC45A2 yielded highly significant replicated associations with skin-reflectance measurements, an indirect measure of melanin content in the skin. The associations detected in these three genes, in an additive manner, collectively account for a large fraction of the natural variation of skin pigmentation in a South Asian population. Our study is the first to interrogate polymorphisms across the genome, to find genetic determinants of the natural variation of skin pigmentation within a human population.
Saturday, October 27, 2007
Neandertals also need their vitamin D
Both Neandertals that they sequenced had a version of MC1R that is not found among modern humans (at least 3,700 of them). This variant is likely to have led to lighter skin/hair. It looks like this will be coming out in Science soon.
A Melanocortin 1 Receptor Allele Suggests Varying Pigmentation Among Neanderthals
Carles Lalueza-Fox, Holger Römpler, David Caramelli, Claudia Stäubert, Giulio Catalano, David Hughes, Nadin Rohland, Elena Pilli, Laura Longo, Silvana Condemi, Marco de la Rasilla, Javier Fortea, Antonio Rosas, Mark Stoneking, Torsten Schöneberg, Jaume Bertranpetit, Michael Hofreiter
The melanocortin 1 receptor (MC1R) regulates pigmentation in humans and other vertebrates. Variants of MC1R with reduced function are associated with pale skin color and red hair in humans primarily of European origin. We amplified and sequenced a fragment of the MC1R gene (mc1r) from two Neanderthal remains. Both specimens have a mutation not found in ~3,700 modern humans. Functional analyses show that this variant reduces MC1R activity to a level that alters hair and/or skin pigmentation in humans. The impaired activity of this variant suggests that Neanderthals varied in pigmentation levels, potentially to the scale observed in modern humans. Our data suggest that inactive MC1R variants evolved independently in both modern humans and Neanderthals.
War promotes altruism and vice-versa
I'll have to take a closer look at how they come up with "conditions likely to have been experienced by late Pleistocene and early Holocene humans" when I have more time... other than that, this seems to make intuitive sense.
The Coevolution of Parochial Altruism and War
Jung-Kyoo Choi and Samuel Bowles
Science 26 October 2007 ; 318:636-640
The Coevolution of Parochial Altruism and War
Jung-Kyoo Choi and Samuel Bowles
Science 26 October 2007 ; 318:636-640
Abstract: Altruism—benefiting fellow group members at a cost to oneself—and parochialism—hostility toward individuals not of one's own ethnic, racial, or other group—are common human behaviors. The intersection of the two—which we term "parochial altruism"—is puzzling from an evolutionary perspective because altruistic or parochial behavior reduces one's payoffs by comparison to what one would gain by eschewing these behaviors. But parochial altruism could have evolved if parochialism promoted intergroup hostilities and the combination of altruism and parochialism contributed to success in these conflicts. Our game-theoretic analysis and agent-based simulations show that under conditions likely to have been experienced by late Pleistocene and early Holocene humans, neither parochialism nor altruism would have been viable singly, but by promoting group conflict, they could have evolved jointly.
Wednesday, October 24, 2007
Social Inequality and Health
This was the hook:
First of all, what happened to Romania, Slovakia and Croatia in their logo below? Is this a prediction of global warming's effect on the Black Sea and the Mediterranean? This paper focused on: how do we explain health inequalities with respect to the stress and changes in endocrine pathways caused by being at the bottom of the social ladder? I'm happy that they referenced Sapolsky and the parallels with other primate hierarchies and measures of cortisol, but I feel that they could have referenced more of the literature on the effect of skin color and racial discrimination on job attainment and health problems, for example. Most of what they talk about in this paper is the inverse gradient between disease related traits and social level. When risk factors are controlled for, (or attempted to control for), they still find that 2/3 of the gradient remains unexplained. Interestingly they find that cancer mortality does not follow that same inverse gradient. Also, interestingly, the risk associated with stress from low status was greater in females.
 Since, after controlling for behavioral factors and general obesity they still find much of the gradient unexplained, they transition into their discussion:
Finally, props to the author for including info on this study on the effects of football (the real football) results on mortality rates - when you experience stress via your national team's loss in a major tournament:
The paper ends with this juicy outlook into future research possibilities:
Intriguing parallels between civil servant and nonhuman primate hierarchies suggest that highly stratified societies foster health inequalities. Determining how social differences translate into chronic disease remains a challenge, but neuroendocrine pathways appear to play a role.to a short paper in PLoS Biology that was part of a "Collection on Poverty"
First of all, what happened to Romania, Slovakia and Croatia in their logo below? Is this a prediction of global warming's effect on the Black Sea and the Mediterranean?
 Since, after controlling for behavioral factors and general obesity they still find much of the gradient unexplained, they transition into their discussion:
That behavior-related factors did not provide a full explanation for the social gradient in metabolic syndrome is consistent with the operation of direct psychosocial and neuroendocrine pathways linking lower social status to CHD risk
...In contrast to this social “embodiment” perspective, it has been argued that biological integrity, in the form of inherited advantage, is the real cause of social inequalities in health.Cognitive function is a high-level expression of this property, and analysis of the changes in test scores over the first ten years of life in a population-based study (the 1970 Birth Cohort) emphasizes the importance of environmental influences. Cognitive performance was first measured at 22 months of age. Children who ranked low at baseline rose through the ranks if their parents were affluent, and conversely, children who ranked high at baseline fell back if their parents were poor. By age seven, the two groups had crossed over in the rankings, whereas children who had both high initial test scores and high social class parents remained near the top of the ranking, and vice versa [8]. These and numerous other findings suggest for the majority of those born without congenital disease, and regardless of the endowment of health capital, a poor early socioeconomic environment is likely to undermine development and later health prospects.then the author goes on to discuss the lessons to be learned from work by R. Sapolsky on baboons:
This correlation matches the proposition of the late Per Bjorntorp that activity of the hypothalamic-pituitary-adrenal axis links psychosocial factors to metabolic syndrome [11]. Further, Sapolsky provided an example of the physiological effects of hierarchy, free of confounding by smoking and alcohol consumption, both of which influence HDL cholesterol levels.So can we measure "stress"?
Many questions remain. The quest for a universal stress biomarker, the Holy Grail of “stress biology,” may be a vain enterprise, but with respect to obesity, diabetes, and cardiovascular disease, metabolic syndrome proves to be a useful construct.I guess they think that metabolic syndrome is a good measure since they find that it is affected only a little by behavioral factors and general obesity.
Finally, props to the author for including info on this study on the effects of football (the real football) results on mortality rates - when you experience stress via your national team's loss in a major tournament:
Box 1. The Power of Mind-Body Interaction: Knockout Stress Triggers Cardiovascular Death among Soccer FansMortality among adults 45 years or over in Holland on 22 June 1996—the day the Dutch football team was eliminated from the European championship—was compared with the 5 days before and after the match and in the same period in 1995 and 1997. Coronary and stroke mortality was increased in men on the day of the match (relative risk 1.51, 95% confidence interval 1.08–2.09). No clear rise in mortality was observed for women (1.11, confidence interval 0.80–1.56). Among men, approximately 14 excess cardiovascular deaths occurred on the day of the match [19].
More feasibly with the newly available high-throughput genotyping technology, we plan to harness Mendel's second law—nature's randomization—to compare stress hyper-responders with their more even-tempered counterparts. By comparing the lifelong effects of genotype with observed phenotype, we have the potential to break the confounding intrinsic to conventional epidemiology, to clarify what is cause and what is effect.
Sunday, October 21, 2007
HapMap II, untaggable SNPs, recombination hotspots and the future
so like I said in the previous post, 2 million additional SNPs were typed in the four HapMap populations, and the findings were reported in the latest Nature issue.
In that paper, they go over some of the patterns they find regarding, untaggable SNPs, recombination hotspots, and discuss some of the related ongoing and future genotyping efforts.
One of their main findings is the relatively high proportion of SNPs that are untaggable (in regions of high recombination, for example):
According to the authors:
NHGRI collection has cell lines for the following populations that they are currently hoping to get HapMap-style SNP genotypes on: (some of the populations are interesting and the website has interesting descriptions of them, such as the Gujarati Indians in Houston)
Maasai in Kinyawa, Kenya
Yoruba in Ibadan, Nigeria
Han Chinese in Beijing, China
Japanese in Tokyo, Japan
Luhya in Webuye, Kenya
Chinese in Metropolitan Denver, CO, USA
Gujarati Indians in Houston, TX, USA
Toscani in Italia
Mexican Ancestry in Los Angeles, CA, USA
African Ancestry in SW USA
Why don't they do this with the CEPH panel instead?
There are also people looking at CNVs on the original HapMap samples,... and then at some point, whole genome sequencing on these samples.
At some point I'll get to the selection paper.
In that paper, they go over some of the patterns they find regarding, untaggable SNPs, recombination hotspots, and discuss some of the related ongoing and future genotyping efforts.
One of their main findings is the relatively high proportion of SNPs that are untaggable (in regions of high recombination, for example):
Despite the SNP density of the Phase II HapMap, there are high-frequency SNPs for which no tag can be identified. Among high-frequency SNPs (MAFso are these SNPs untaggable due to high local recombination rates?: (answer: yes, probably)0.2), we marked as untaggable SNPs to which no other SNP within 100 kb has an r2 value of at least 0.2. In Phase II, approximately 0.5–1.0% of all high-frequency SNPs are untaggable and the proportion in YRI is approximately twice as high as in the other panels.
Over 50% of all untaggable SNPs lie within 1 kb of the centre of a detected recombination hotspot and over 90% are within 5 kb. Because only 3–4% of all SNPs lie within 1 kb from the centre of a detected recombination hotspot (16% are within 5 kb), this constitutes a marked enrichment and implies that at least 10% of all SNPs within 1 kb of hotspots are untaggable. The implication for association mapping is that when a region of interest contains a known hotspot it may be prudent to perform additional sequencing within the hotspot. Many of the variants identified in this manner will be untaggable SNPs that should be genotyped directly in association studies.They also discuss something that I've always wondered about. What determines where recombination takes place? According to them, some of the leading ideas are specific DNA motifs that influence hotspot location and some other things about the sequence including locations of genes - so, in other words, it seems that no one really knows for sure.
According to the authors:
The Phase II HapMap provides the resolution to separate these influencesWhat they find:
Within the transcribed region of genes there is a marked decrease in the estimated recombination rate. However, 5' of the transcription start site is a peak in recombination rate with a corresponding local increase in the density of hotspot motifs. This region also shows a marked increase in G+C content, reflecting the presence of CpG islands in promoter regions. There is also an asymmetry in recombination rate across genes, with recombination rates 3' of transcribed regions being elevated (as are motif density and G+C content) compared to regions 5' of genes. Studies in yeast have previously suggested an association between promoter regions and recombination hotspots39. Our results suggest a significant, although weak, relationship between promoters and recombination in humans. Nevertheless, the vast majority of hotspots in the human genome are not in gene promoters. The association may reflect a general association between regions of accessible chromatin and crossover activity.They then examine if recombination happens more around some types of genes. They use the Panther database of gene ontology to classify the genes and see if there are any noticeable patterns, and they find some interesting ones:
Average recombination rates vary more than sixfold among such gene classes (Fig. 5b), with defence and immunity genes showing the highest rates (1.9 cM Mb-1) and chaperones showing the lowest rates (0.3 cM Mb-1). Gene functions associated with cell surfaces and external functions tend to show higher recombination rates (immunity, cell adhesion, extracellular matrix, ion channels, signalling) whereas those with lower recombination rates are typically internal to cells (chaperones, ligase, isomerase, synthase). Controlling for systematic differences between gene classes in base composition and gene clustering, the differences between groups remain significant. We also find that the density of hotspot-associated DNA motifs varies systematically among gene classes and that variation in motif density explains over 50% of the variance in recombination rate among gene functions.and then they briefly discuss the interesting evolutionary implications: namely that highly conserved gene functions are "protected" from recombination, while those involved in defnese and immunity from the everchanging outside world are more likely to be shuffled around...makes sense, I suppose.

...hotspots may be selected against in some highly conserved parts of the genome. In regions exposed to recurrent selection (for example, from changes in environment or pathogen pressure) it is plausible that recombination may be selected for. However, because the fine-scale structure of recombination seems to evolve rapidly, it will be important to learn whether patterns of recombination rate heterogeneity among molecular functions are conserved between species.They go on to discuss some of the ongoing related projects: basically more populations, and more forms of variation:
NHGRI collection has cell lines for the following populations that they are currently hoping to get HapMap-style SNP genotypes on: (some of the populations are interesting and the website has interesting descriptions of them, such as the Gujarati Indians in Houston)
Maasai in Kinyawa, Kenya
Yoruba in Ibadan, Nigeria
Han Chinese in Beijing, China
Japanese in Tokyo, Japan
Luhya in Webuye, Kenya
Chinese in Metropolitan Denver, CO, USA
Gujarati Indians in Houston, TX, USA
Toscani in Italia
Mexican Ancestry in Los Angeles, CA, USA
African Ancestry in SW USA
Why don't they do this with the CEPH panel instead?
There are also people looking at CNVs on the original HapMap samples,... and then at some point, whole genome sequencing on these samples.
At some point I'll get to the selection paper.
Subscribe to:
Posts (Atom)